5 features of Obsidian Graph View and how I use them
Overview
Today I am blogging about about the new Graph View features in Obsidian 0.91.
There are many great videos already out there that show the new features in action. But some of these videos don't explain how users can use these new features in their workflow.
I will walk-through five of the essential features that I use in Graph View and also try to explain how I use it in my workflows and some improvements I would like to see in future releases.
I hope you will see some opportunity to use these features in your workflow to save you time and create new ideas
If you are interested in more techniques, tools and hacks for your workflow, please subscribe to my YouTube channel.
If you enjoy the content and found it useful, please press the like button, so I know to make similar content.
1. Search
I am a visual person, so the graph view is an opportunity to see all my notes in one place.
After two months following my custom Zettelkasten process, I have captured 155 source notes and over 20 permanent notes in the subject of personal workflows.
In future I can see this number increasing enormously so I think the graph view will be a crucial tool in identifying new ideas among so many notes.
In 0.91 release, Obsidian developers have introduced a search functionality to help you show what you want in the Graph view.
The search functionality acts the same way as the one in the file search. I created a video of some of the common searches I use in file search.
Graph view search allows you to find
- keywords
- tags
- folders
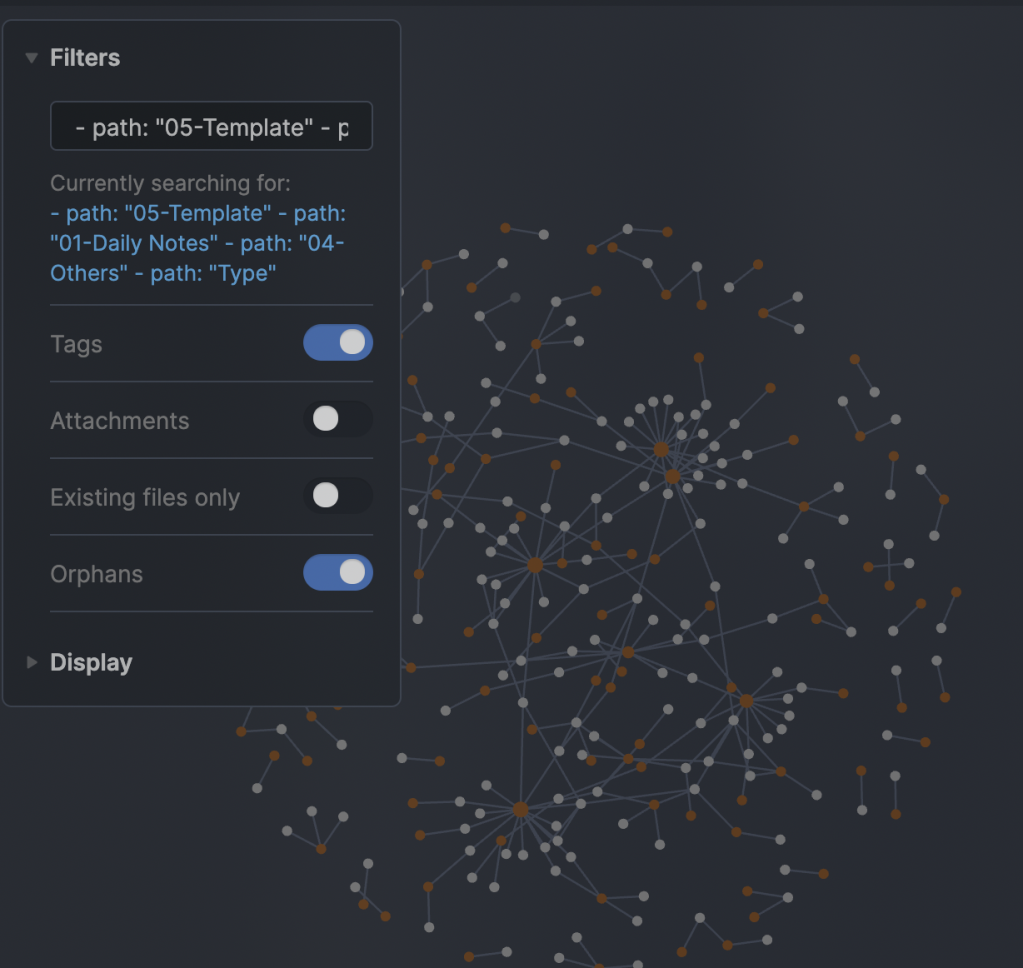
The way I use this feature is to filter notes out that I do not want to see.
So when I look for new ideas for content, I start by removing the folders I don't need such as template folders and daily notes.
I do this by using the - path: "with the folder name."
Once I removed the folders I do not want; I go through these notes and see if I can group them up into new ideas and create permanent notes for them.
I think it would be useful to have a place to save regularly used graph view searches. Having this in graph view search will save time and make it more user friendly.
2. Tags
I was very unsure about using tags at the beginning when I first set up my Obsidian vault.
I use tags to describe keywords relating to a source note and mash them up to create new ideas for permanent note.
Graph view now shows these tags by the user switching on the option in the selection.
When the user switches on the tags option, it helps to see the links between tags to other source notes.
Having this means when I am trying to enrich content, I can follow the trail from tag to source to tag to another source to have a different view of the content I am creating.
The tags are also coloured differently to the standard notes, so its easier to follow.
I really enjoy using the tags feature and recommend new users to add tags to source notes.
3. Orphans
I capture notes into Obsidian in many different ways, including iPhone, iPad, MacBook, tweets and kindle books.
When I can, I add my summary, but sometimes I capture the information first with a task to process them later on.
These usually exist as an orphan note with no links to other source or permanent notes.
Previously I was using graph view to find orphan notes to link to the source or permanent notes.
Now on Graph View, you can hide orphan notes from the Graph View.
Doing this has two benefits:
1. It helps to find the orphan notes quicker.
2. More importantly, when I filter down using the search, I know these orphan notes fit the criteria of something I am searching. The search result also tells me I should review the note to see if is something useful for my content.
One improvement to this feature is to show only orphan notes without the notes that are linked together, allowing me to through orphan notes and link them to other notes. At the moment, I use a to "be process" tag to overcome this.
4. Display
The new display section allows users to change the Graph View.
The benefits of this change are that it
1. makes it easier to manage the graph view screen when there a vast number of notes
2. Also it makes navigation more comfortable to find the notes you are interested.
Let's have a look at the features.
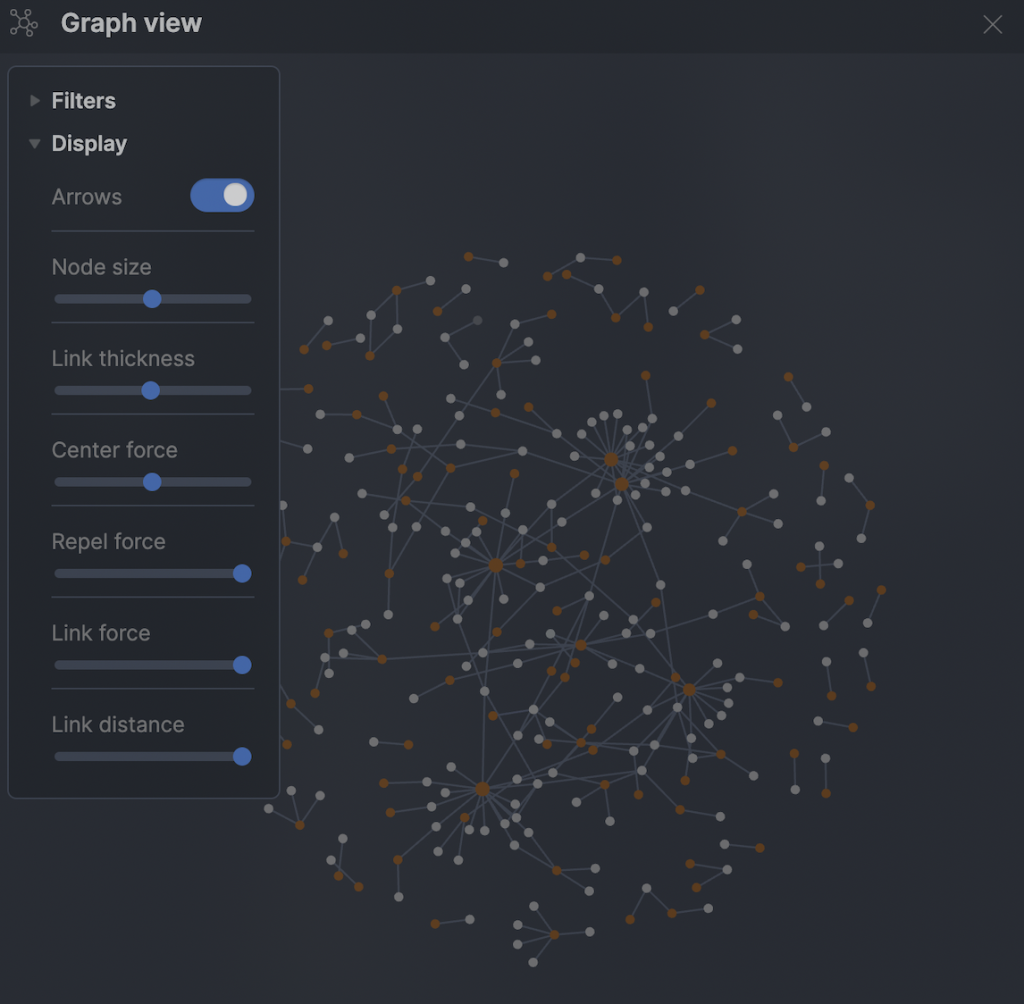
1) Arrows option shows the direction of how notes link to each other. Where we have a note with arrows pointing to it, it means another note is referencing the note.
2) Node size makes each node bigger or smaller. The node size seems to vary depending on the number of items linked to it.
3) Link thickness increases the thickness of the connection line.
4) Center force resizes the graph to the centre. I use this to fit the graph into the area I have on my screen.
5) Repel force resizes the length between nodes on the graph.
6) Link force restructures the graph between linked notes. I usually leave this on one.
7) Link Distance changes the length between two linked nodes. I usually adjust this to fit the label.
I hope in the future; we can set different notes to different colour either by folders or another means. Allowing me to do this will allow me to see which ones are source notes and which ones are permanent.
5. Local graph view
Finally, the area where I think the changes to graph view mostly benefits users is in the local graph view.
There are three additional options:
1) Incoming links
2) Outgoing links
3) Neighbour links
Let's look at each of these.

1) Incoming links show where another note links to this one. In this example, the local note connects to an index.
2) Outgoing links show where local note references other notes within it. In this example, this permanent note links to two other permanent notes
3) Neighbour links shows the relationship between notes that are indirect links.
As you increase the depth, you can see more and more notes that are linked indirectly to this note.
I think these features will become particularly important if you were writing a book.
For example, when you are starting to write a book, you can create a book note. It has links to each chapter. Each chapter consists of content that references a group of idea notes. Each idea note will then reference a source note.
The features in the local graph view can help you visualize your book structure and see where ideas and sources overlap.
Summary
You will have seen some of the important features of the graph view that will help you develop ideas and build out your content.
1) the Graph View search can be used to find related notes but more importantly filter out notes that are crowding the graph view.
2) The inclusion of tags in Graph View makes it easier to see how source notes are linked together.
3) Orphan option allows you to filter out orphan notes but also makes it easier to see them, to investigate and incorporate them into your connections.
4) New display options give you greater control to look through your graph view and organize it depending on screen size available to you.
5) Additions to the Local Graph View gives you greater detail on the connections to your permanent note which is useful when enriching content.
The upgrades to Graph View makes Obsidian even more useful for creating ideas and enriching